Tuning auditd: high-performance Linux Auditing
This article has last been updated at .
The Linux Audit framework is a powerful tool to audit system events. From running executables up to system calls, everything can be logged. However, all this audit logging comes at the price of decreased system performance. Let’s have a look at how we can optimize our audit rules.
Performance tips
Good auditd performance will reduce stress on the Linux kernel and lower its impact. Before changing anything to your system, we suggest benchmarking your system performance before and after. This way you can see the benefits of your tuning efforts.
Strategy: Rule Ordering
Placing rules in the right order
Many software packages use “order based rule processing”. This means each rule is evaluated, until one matches. For the Linux audit daemon, this principle applies as well.
So one of the biggest areas to tune is the order of the rules. Events which occur the most should be at the top, the “exceptions” at the bottom.
If your Linux audit set-up is done alphabetically, you can be assured this configuration is not optimized for performance. Let’s continue tuning auditd in some other areas.
Strategy: Excluding Events
Determining what message types are used a lot
The challenge with logging events, is to ensure that you log all important events, while avoiding logging the unneeded ones.
Some administrators apply the “just log everything” rule. While it often makes sense, it is definitely not efficient and decreases the performance of the Linux kernel. This kind of logging will definitely decrease the processing time of auditd and have a negative impact the performance of the kernel.
To enhance the logging, we first need to determine what events often show up.
Most events sorted by executable
aureport -ts today -i -x --summary
Most events sorted by system call (syscall)
aureport -ts today -i -s --summary
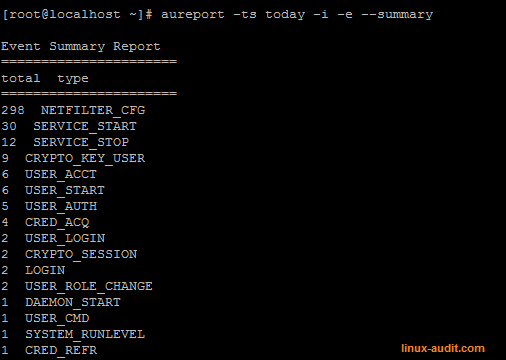
This will reveal what executable or system call is flooding your audit logs. By defining “-ts today” we only see the recent events.
The output of aureport definitely helps to reduce the amount of logging, by disabling some events. Of course you can do this also for events, files and other types. See the man page of aureport for more details.

Summary of aureport showing events which occurred today
Ignoring events
Now we know what type of files, events or other messages we have, we can ignore them. For that we have to make a rule, which matches and states the exclude of exit statement.
The exit statement is used together with syscalls, for others we use exclude.
Filter by message type
For example disabling all “CWD” (current working directory), we can use a rule like this:
-a exclude,always -F msgtype=CWD
As the first match wins, exclusions have to be placed at the top of the rule chain. As this is a filter based on a message type, we use exclude.
Filter by multiple rules
Another example is suppressing the messages logged by VMware tools. For that we combine multiple rules together, by providing multiple -F parameters. You are allowed up to 64 fields, but usually a few are enough. When using -F, each expression will be checked with a logical AND statement. That means all fields have to be true, to trigger the action of the audit rule set.
-a exit,never -F arch=b32 -S fork -F success=0 -F path=/usr/lib/vmware-tools -F subj_type=initrc_t -F exit=-2
-a exit,never -F arch=b64 -S fork -F success=0 -F path=/usr/lib/vmware-tools -F subj_type=initrc_t -F exit=-2
Note: some examples might have different results on older machines. Therefore always test each rule to determine if it works. Rules which don’t do anything are only negative for performance.
Strategy: Determine Buffering Needs
Tuning buffer needs for auditd
By default the auditctl can provide some statistics when using the -s (status) flag. It shows its status (enabled), any related flags, process ID and log related statistics (backlog, rate, lost).
# auditctl -s
enabled 1
flag 1
pid 430
rate_limit 0
backlog_limit 320
lost 0
backlog 0
enabled -1
flag 0
pid 0
rate_limit 0
backlog_limit 320
lost 0
backlog 0
Allowing bigger buffers means a higher demand on memory resources. Depending on your machine this might be a small sacrifice, to ensure that all events are logged.
To determine the best possible buffer size, monitor the backlog values. They should not exceed the backlog_limit option (in our case 320). Another useful statistic is the monitor the lost value, as it will tell you how many events could not be processed. On a normal system, this value should equal or close to zero.
Strategy: Monitoring Directories
Use path instead of dir when monitoring a specific directory
There are two ways to monitor the contents of a directory: path or dir.
Depending on what you want to monitor, monitoring subdirectories might not be needed. In such case it is better to use the path option, as it monitors only that directory. It’s a small adjustment, which might save you a lot of unneeded audit logging.

