Understanding what runs on your Linux system (and why)
This article has last been updated at .
Introduction
Each Linux system has a bunch of processes running. Most of these processes might be familiar to you if you regularly use a command like ps or top to display them. Processes may look like just an item in a list. They are actually complicated pieces of code that are tamed by a memory manager. To truly understand how your system is running, knowledge of process (or memory) management is of great help. So let’s make a jump into the internals of Linux by learning the tools at our disposal.
What is a process?
Each system has a particular goal it wants to achieve. Such a goal could be providing a website to anonymous visitors all over the world. To enable that, there should be something listening to the individual website requests, process them, and finally send back the related website page. We call this a process and it consists of machine code. These are individual instructions on what the system should do. These instructions include reading an image from the hard disk, sending data via the network interface, or saving an error message in a log file.
Processes come in different forms. The most common type is the commands you may type into a shell program. A shell is a “wrapper” for your Linux console or virtual terminal screen (when using SSH). Most users use the default Bourne Again Shell (or bash). It allows you to type in text, and it will act upon this input. For example, when you type in a command like ls, it sees this as a known command and executes it.
The real magic happens when you run commands. In this event, the shell will decide to run a built-in action or start a program from the hard disk. We call these programs on disk a ‘binary’. This binary itself is stored with a specific format, which is typically ELF .
What is a Linux daemon?
Some processes have the goal to run for a long time on the system in the background. This could be to fulfill requests like scanning an incoming email or sending back a page of a website. These processes are called daemons. Besides the duration, another big difference is that daemons do not need interaction with the terminal. Typically they won’t send any data to it but use log files instead. Daemons are often started directly after the operating system started. Most have a ’d’ at the end of the process name, to hint that they are a daemon process.
The name daemon comes from an experiment based on Maxwell’s demon
, that had the job of sorting things in the background.
Good to remember: A daemon is always a process, but not all processes are a daemon
What about services?
Typically the term ‘service’ was used on Windows systems. With the introduction of systemd, this term is now more applicable for Linux as well. A service is a combination of resources to provide some functionality. For example an SSH service, that consists of running the related daemon and any dependencies like networking.
Running processes
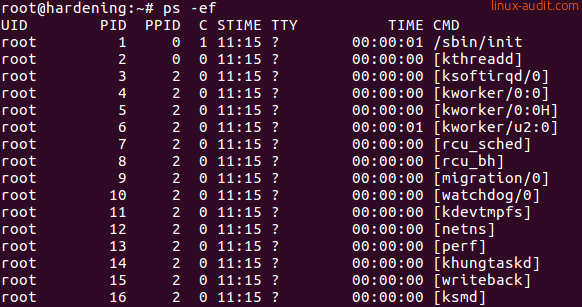
There is a lot of information to gather and show running processes. Common tools for this job include the ps and top command. Let’s start with some basic output that you may get from the first command.

What see in this screenshot is a small listing of processes. Nothing really fancy, right?The process name itself, or actual the command, is at the right (CMD column). We see that the first process is
The most common thing we look at, is the process name itself or actual the command. This one is displayed at the right (CMD column). We see that the first process is /sbin/init, which is a common system manager for Linux distributions. The other processes have brackets in their name, which is an indicator that they are kernel threads. This screenshot gives a hint for that, as it includes both the PID and PPID columns. The PID is the process identifier, a unique number for a process on that system at that time. The PPID is the parent process identifier. Both the init process and [kthreadd] have a PPID of zero, which means they don’t have a parent process. In other words, these processes stand on their own.
If we continue to read the output, we see UID in the process listing, which is the user identifier. Typically the user that started this process, or the owner of the process. The small C column is the CPU usage. On most systems you will see that many processes have a zero, meaning there isn’t a lot going on. Later in the list of processes, there is a good example: the unattended-upgrade tool is demanding a good share of CPU cycles (67 percent).

If we look at the TTY column, we see that many processes have a question mark. This means they are non-interactive and have no need for a terminal. User ‘michael’ connected via SSH (third line) and got the bash shell (first line). That process has the ’tty1’ terminal, which means it is an interactive process. Finally, the STIME refers to when the process was started. It shows just the time if it was today. Otherwise, a date will be included. The TIME column is how much time the process consumed in CPU usage. Processes that are CPU hungry will have a higher number here.
Note: Linux users typically use -ef for the ps command, where BSD users are familiar with dashless aux. The output is similar, but minor differences may exist between the operating systems, the version of ps, and the related flags used.
Process data
The Linux kernel is a complicated machine in itself. It forms the bridge between hardware and software. Its primary goal is to make sure that both sides behave while still process as many requests as possible. A challenging task with hardware interrupts calling continuously for attention, and software known to be sometimes less stable than anticipated.
To account for everything running on the system, the kernel needs to track every movement on the system. Especially memory management needs attention. The memory is divided into several zones and then provisioned to the running processes. To prevent misusage, there are guards that monitor the requests for more memory. The goal is to prevent running Out Of Memory (OOM). Otherwise, the OOM killer has to be unleashed from its cage and it starts killing processes to free up memory. Other guards ensure one process can’t see the data of other processes, which would be bad for security. Similarly, there are protections that prevent memory segments being incorrectly used, like a data-only area that suddenly runs (malicious) machine code.
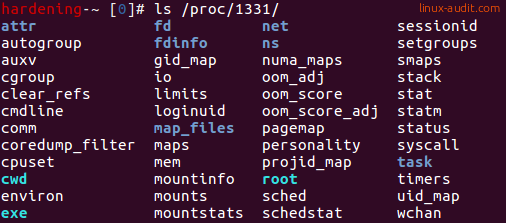
Some of the internal data maintained by the kernel is also useful for the system administrator. The pseudo-filesystem /proc is used for this. A directory is created per PID in this filesystem. In Linux, everything is a file. So each directory consists of a bunch of files. Most of them can be viewed by using the cat command.

Some examples:
- cmdline - displayed with ps
- comm - command
- limits - restrictions like maximum file handles
- mounts - the visible mounts for the process
- sched - time scheduler details
- smaps - shared memory details
- status - process details, ownership, memory usage
While it is interesting to review all files, some smart people created tools to read this data and show it in a more friendly way. Let’s have a look at that.
Linux monitoring, troubleshooting, and in-depth analysis
To really learn what your system is doing, you need the right tools for the job. Typically you need a combination of tools to find the cause. For example, a system with a high load could have multiple causes. One of them is high IO, meaning data being written to the disk, or send over the network. So troubleshooting may require taking two or three steps before getting closer to the source.
Let’s learn a bit about processes by answering the most common questions. These are situations you may encounter to run a system and keep it stable.
How much memory has the system available?
The free command allows you to see the memory and swap statistics. This is useful to determine the totals, used, and free memory.
free

How can I find all the PIDs for a specific program?
The first thing that may come in mind, is using the ps command. Then combine it with the grep command and just show the lines that you want to have.
ps -ef | grep nginx
If you like to create an one-liner, or put things in a shell script, use the pgrep command.
pgrep nginx
If you want to have it formatted (e.g. with a comma between each PID), use it with the -d and -f flag.
pgrep -d',' -f nginx
How much memory does a process use?
Linux systems will try to use as much memory as possible for performance reasons. So it is good to know that there are a few values of importance here. The first field is RSS, which stands for Resident Set Size. While there are whole books about memory management, you can see this field as the memory it needs to put the program into memory. Typically just a few megabytes or less. Then there is VSZ, the Virtual Memory Size. This is the memory that the program has access to. This is usually a lot more than the RSS. But it doesn’t mean all this memory is really in use.
To see specifically the details, we can use the ps command for this task. We can even filter the fields we need and tell it which PID (or PIDs) we are interested in.
ps -o vsz,rss,cmd --pid $(pgrep command)
Make sure that the command returns something, otherwise the **-**pid argument has no values.

If you want to keep monitoring a running process, you can use the top command. By providing a specific PID (or multiple), you can filter out the process you are interested in. Great for monitoring database instances, or your favorite web server daemon.
top -c -p $(pgrep -d',' -f nginx)
Which process has the most disk activity?
Disk usage is one of the most common reasons for a high load. In this case, finding the possible culprit is easy with the pidstat command.
pidstat -d
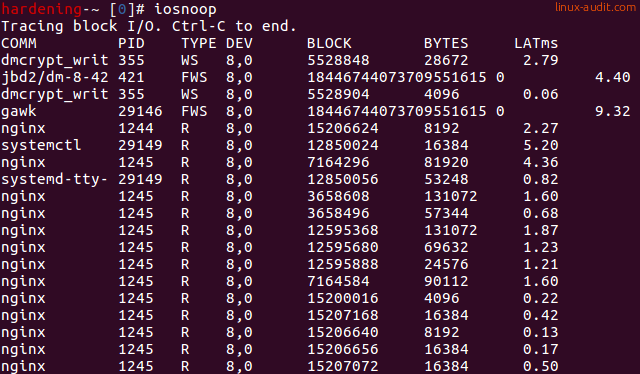
To see an actual disk usage, use the iosnoop command.

Which new processes are started?
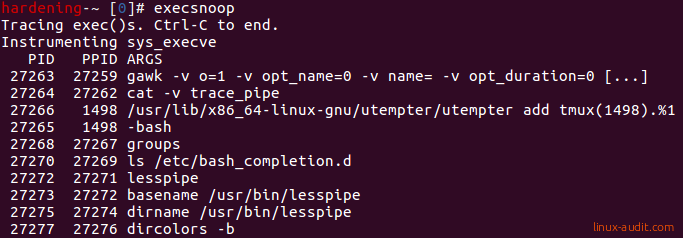
The Linux audit framework could be used to monitor for specific system calls. An easier way is to use the execsnoop command. Depending on your distribution you may be able to install this via the package manager.
execsnoop

Any other tools or one-liners you use during troubleshooting? Let it know!

