Which Linux process is using a particular network port?
This article has last been updated at .
Most network related services have to open up a network socket, so they can start listening for incoming network requests. It is common to find the TCP or UDP being used as the main communication protocol. In this article, we will check what ports are used by which Linux process.
Find out what process is listening to a port
Only one process can actively listen to a TCP or UDP port. We usually only discover this when another process is already running on a specific port, while we try to start another service:
[emerg] 9400#0: bind() to 0.0.0.0:80 failed (98: Address already in use)
or something like:
nc: Address already in use
Time to tackle which process is keeping these addresses or ports in use!
Using lsof to show open files and network ports
Let’s start with a powerful utility named lsof. It is not always installed by default, but still a very common utility. Its name is derived from listing open files. In Linux, even a network socket is a file. So this is definitely the right utility to retrieve some useful information. LSOF will include network-related data like port numbers and process names.
To find open ports and the related processes, ask lsof to see the related details. We filter out all UDP ports and only want to see TCP ports that are listening to data.
lsof -Pni | grep -E "(UDP|LISTEN)"
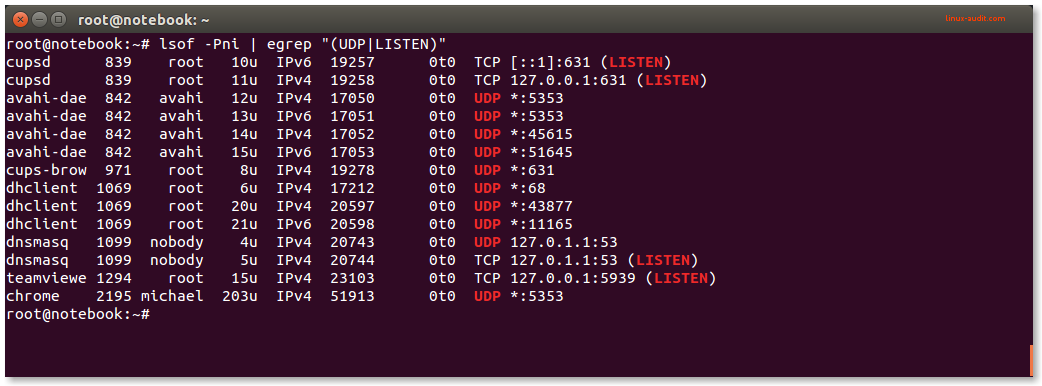
This output might look something like this:

Lsof displaying UDP ports and TCP ports in LISTEN state
This commands includes all UDP ports and for TCP only the ports which are actually in “LISTEN” state. Perfect to determine which process is listening to what port (or ports).
If you are interested in a particular port, lsof can filter by protocol and port number.
lsof -i TCP:80
Using netstat to show ports and applications
The netstat is another utility to determine what processes are running and what port they listen to. It is available on most systems by default, although it is replaced by ss.
netstat -nlp
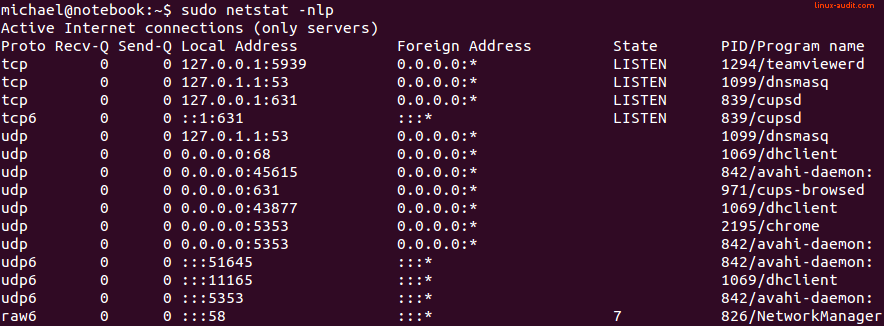
The result might be looking something like this:

Netstat showing all running processes and ports they listen to
In this output, we see the following details:
| Column | Information field |
|---|---|
| 1 | Proto |
| 2 | Recv-Q |
| 3 | Send-Q |
| 4 | Local Address |
| 5 | Foreign Address |
| 6 | State |
| 7 | PID/Program name |
Protocol
The protocol (Proto) defines the data transfer protocol. This is typically tcp or udp for IPv4, tcp or udp6 for IPv6.
Receive and Send queue
The Recv-Q and Send-Q are the queues to for receiving or sending data. In the output they are usually zero unless a transfer occurs at that moment.
Local and foreign address
The Local Address field specifies the IP address with the related port number. Can listen to a particular IP address (like localhost or 127.0.0.1) or on all interfaces (0.0.0.0 for IPv4). This is usually the interesting part to filter out (tip: use grep).
State
The State column is usually showing LISTEN for TCP.
PID and program name
Then finally the PID/Program name column shows the actual process that is listening to a particular network port.
Using the ss command
f you don’t have the netstat utility available, it might have been replaced with a newer toolkit. In that case, you usually have the ss utility available (iproute2 package).
To use the ss tool to see on Linux which ports are used by a particular process:
ss -lpntu
This will show a similar output. It shows all the listening ports, limited to UDP/TCP only, not translated to hostnames to speed up the results.
Detecting network ports for new processes
Sometimes you might be running a new process and not aware of any network ports being opened. This might occur when it just quickly happens, or due to a port listening conflict. Also when running services in containers, it might be harder to know what ports need to be opened, to get it fully functioning.
In these cases, the strace utility is of great help. It can track a running or new process and alert for any events of your interest. To track the open request of a network port, we can monitor the related system call (syscall), which is ‘bind’.
strace -f -e trace=bind nc -l 80
With this command we will see quickly after execution the following line:
bind(3, {sa_family=AF_INET, sin_port=htons(80), sin_addr=inet_addr(“0.0.0.0”)}, 16) = 0
This means it tried to open a network socket with port 80. Unfortunately, it does not show if it opens a TCP or UDP port. If we broaden the system calls a little bit, this information becomes available:
# strace -f -e trace=network nc -lu 80
socket(PF_INET, SOCK_DGRAM, IPPROTO_UDP) = 3
setsockopt(3, SOL_SOCKET, SO_REUSEADDR, [1], 4) = 0
bind(3, {sa_family=AF_INET, sin_port=htons(80), sin_addr=inet_addr("0.0.0.0")}, 16) = 0
Conclusion
That’s it for today. Linux systems are very versatile, yet sometimes need the right tool to dig into the details you want to know. With tools like lsof, netstat, ss, and strace, we can find exactly the network information we are looking for.
Did this article help you or have a good one-liner for other readers? Let it know, to make this article even better!

