Monitor file access by Linux processes
This article has last been updated at .
Processes are the running workforce on a Linux system. Each process has a particular goal, like forking child processes, handling incoming user requests of monitoring other processes. As a system administrator or IT auditor, you might want to know at some point what disk activity occurs in a process. In this article, we have a look at a few options to quickly reveal what is occurring in a process, including disk and file activity.
Monitor syscalls
The kernel uses system calls, or syscalls for short. These are specific functions, which perform a low-level system function. Think of activities like reserving a memory section, or in this case opening a file from disk. The first utility to provide insights in active syscalls, is the strace utility. By tracking the right system call, we can see exactly what files are opened while it happens. Great for tracking required file access, dependencies, and troubleshooting purposes.
The usage of strace is simple. Just run a command you normally would execute, prepended with the strace utility.
strace ls
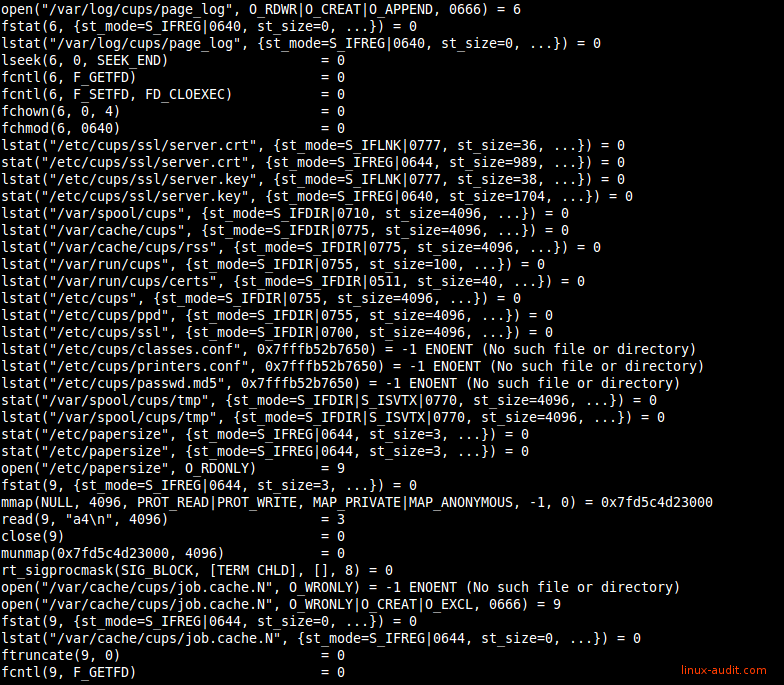
If you run the same command on the CUPS daemon, this would be the output:

Lots of output after starting a strace on a running process
While this provides interesting information, it might actually flood your screen, making it hard to work with. As we are interested in file access, we want to see only the open syscall.
strace -f -e open ls 2>&1
So let’s first check what chain does: start strace, track forked childs (-f) for the open system call (-e open). As command we track the ls utility and redirect any errors to the screen output. For other interesting system calls, see the man 2 syscalls page.
If you want a clean output which only shows , here is a trick to only list the files:
strace -f -e open ls 2>&1 | grep ^open\( | grep "[[:digit:]]\+$" | cut -d\" -f2
We can also apply monitoring system calls to a running process. Provide the -p and define the process ID you want to monitor. If you also want to monitor any forked child processes like in previous example, add the -f parameter.
strace -f -p 4121
Most systems have the strace utility already installed by default. If you have a minimal installation without it, use your package manager.
Tracking system calls
The second option to check what system calls are used, is by monitoring the libraries used. Libraries are similar to a toolbox, filled with individual functional tools. In the case of Linux, the library is filled with functions, including indirect system functions.
Monitoring these functions can be done with the ltrace utility. Its usage is similar strace, but with the focus on libraries.
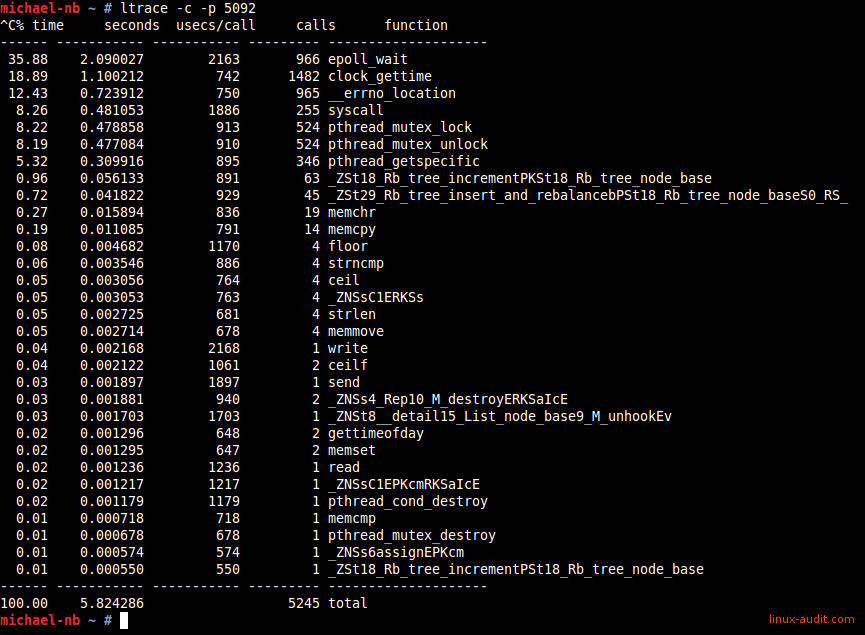
To get a first impression what kind of functions are used, use the -c parameter. It lists the functions, how often it was used (calls) and the time involved with that function. Great for troubleshooting why a process is taking a while to respond.
ltrace -c ls
An example output of a trace on a Chrome process:

Using ltrace to track system calls (syscalls)
Like strace we can attach to a process. For example tracking what the cron process does:
# ltrace -p 1275
time(0) = 1435911661
localtime(0x60b300) = 0x7f36b92ecde0
__xstat(1, "crontabs", 0x7fffb2700c60) = 0
__xstat(1, "/etc/crontab", 0x7fffb2700cf0) = 0
__xstat(1, "/etc/cron.d", 0x7fffb2700d80) = 0
__sprintf_chk(0x7fffb2700fa0, 1, 4097, 0x407e89) = 16
__xstat(1, "/etc/cron.d/php5", 0x7fffb2700e10) = 0
__sprintf_chk(0x7fffb2700fa0, 1, 4097, 0x407e89) = 19
__xstat(1, "/etc/cron.d/anacron", 0x7fffb2700e10) = 0
__sprintf_chk(0x7fffb2700fa0, 1, 4097, 0x407e89) = 23
__xstat(1, "/etc/cron.d/amavisd-new", 0x7fffb2700e10) = 0
gmtime(0x7fffb2702fa8) = 0x7f36b92ecde0
time(0) = 1435911661
sleep(60
It will do nothing for a while and suddenly it shows up. It looks in several common cron related files (like
/etc/crontab
and /etc/cron.d). The __xstat function in this case monitors the files and tries avoiding opening each of them, unless it file meta information changed (e.g. modification date). The output suddenly looks different:
# ltrace -p 1275
time(0) = 1435912201
localtime(0x60b300) = 0x7f36b92ecde0
__xstat(1, "crontabs", 0x7fffb2700c60) = 0
__xstat(1, "/etc/crontab", 0x7fffb2700cf0) = 0
__xstat(1, "/etc/cron.d", 0x7fffb2700d80) = 0
__sprintf_chk(0x7fffb2700fa0, 1, 4097, 0x407e89) = 16
__xstat(1, "/etc/cron.d/php5", 0x7fffb2700e10) = 0
__sprintf_chk(0x7fffb2700fa0, 1, 4097, 0x407e89) = 19
__xstat(1, "/etc/cron.d/anacron", 0x7fffb2700e10) = 0
__sprintf_chk(0x7fffb2700fa0, 1, 4097, 0x407e89) = 23
__xstat(1, "/etc/cron.d/amavisd-new", 0x7fffb2700e10) = 0
gmtime(0x7fffb2702fa8) = 0x7f36b92ecde0
time(0) = 1435912201
sleep(60) = 0
time(0) = 1435912261
localtime(0x60b300) = 0x7f36b92ecde0
__xstat(1, "crontabs", 0x7fffb2700c60) = 0
__xstat(1, "/etc/crontab", 0x7fffb2700cf0) = 0
__xstat(1, "/etc/cron.d", 0x7fffb2700d80) = 0
__sprintf_chk(0x7fffb2700fa0, 1, 4097, 0x407e89) = 16
__xstat(1, "/etc/cron.d/php5", 0x7fffb2700e10) = 0
__sprintf_chk(0x7fffb2700fa0, 1, 4097, 0x407e89) = 19
__xstat(1, "/etc/cron.d/anacron", 0x7fffb2700e10) = 0
__sprintf_chk(0x7fffb2700fa0, 1, 4097, 0x407e89) = 23
__xstat(1, "/etc/cron.d/amavisd-new", 0x7fffb2700e10) = 0
__lxstat(1, "/etc/crontab", 0x7fffb2700cf0) = 0
open("/etc/crontab", 0, 00) = 4
__fxstat(1, 4, 0x7fffb2700cf0) = 0
After seeing the change, it uses a __lxstat and then the open function. The difference between normal functions and those prepended with two underscores, is that the latter are wrappers. Usually around the equally named function name, to provide a transparent wrapper and ensure the correct input and output.
Couldn’t find .dynsym or .dynstr in …
Some files can not be traced with ltrace and may result something like:
Couldn’t find .dynsym or .dynstr in “/proc/2098/exe”
If you encounter this error, you most likely have a statically linked binary. All functions are then inside the binary and not in a library. As ltrace can track libraries only, you have to use strace instead.
List Open Files
Everything on disk is a file. Normal files, devices and even directories are all presented as a file. The file system marks each of these entries in a file table, with the related type. While you might normally not even notice due to colored screen output, directories have a different type. It is the “d” in the first column in a long listing (-l) output of ls. Common types include a directory (d), a block or character based device (b/c) or a normal file (-, minus).
To see open files, we can use the lsof utility. It stands for “list open files” and definitely reveals its purpose. It can really show any type of open files, from the earlier mentioned special files (block and character devices), to tracking open network connections.
One big disadvantage of the lsof utility should be shared up front: there are way too many options to remember. The man page doesn’t make things easier, especially if you don’t know exactly what to look for. So getting exactly the right output is usually experimenting. At the bottom we have share some common used examples, to make this process easier.
Lsof commands
Processes
lsof -c cupsd= show open files for cups daemon
Networking
lsof -i -n= show open network connections (without name resolving)lsof -i4orlsof -i6= show IPv4 or IPv6 trafficlsof -N= show NFS
Tracking syscalls with Linux Audit
We already have written some posts about the powerful Linux audit framework. This built-in kernel feature allows tracking files and system calls. Of course we can combine both. We define what process we want to track and the related system call. Similar to strace we use the “open” system call.
Create rule: open
Use auditctl to define a watch.
auditctl -a always,exit -F arch=b64 -F pid=8175 -S open -k cups-open-files
This rule adds a system call monitor on “open” (with 64 bits architecture), for PID 8175. Now when this process uses the open system call, it will be logged in the audit log. We give it a key “cups-open-files”.
Search for file activity
We can easily find them by referring to the earlier defined key “cups-open-files” with the ausearch command.
# ausearch -k cups-open-files
--
time->Fri Jul 3 15:31:20 2015
type=CONFIG_CHANGE msg=audit(1435930280.293:390): auid=4294967295 ses=4294967295 op="add rule" key="cups-open-files" list=4 res=1
--
time->Fri Jul 3 15:31:31 2015
type=PATH msg=audit(1435930291.853:392): item=0 name="/etc/group" inode=5377472 dev=08:05 mode=0100644 ouid=0 ogid=0 rdev=00:00 nametype=NORMAL
type=CWD msg=audit(1435930291.853:392): cwd="/"
type=SYSCALL msg=audit(1435930291.853:392): arch=c000003e syscall=2 success=yes exit=4 a0=7fd5c0909351 a1=80000 a2=1b6 a3=0 items=1 ppid=1 pid=8175 auid=4294967295 uid=0 gid=0 euid=0 suid=0 fsuid=0 egid=0 sgid=0 fsgid=0 ses=4294967295 tty=(none) comm="cupsd" exe="/usr/sbin/cupsd" key="cups-open-files"
--
time->Fri Jul 3 15:31:31 2015
type=PATH msg=audit(1435930291.853:391): item=0 name="/etc/passwd" inode=5377470 dev=08:05 mode=0100644 ouid=0 ogid=0 rdev=00:00 nametype=NORMAL
type=CWD msg=audit(1435930291.853:391): cwd="/"
type=SYSCALL msg=audit(1435930291.853:391): arch=c000003e syscall=2 success=yes exit=4 a0=7fd5c090935c a1=80000 a2=1b6 a3=0 items=1 ppid=1 pid=8175 auid=4294967295 uid=0 gid=0 euid=0 suid=0 fsuid=0 egid=0 sgid=0 fsgid=0 ses=4294967295 tty=(none) comm="cupsd" exe="/usr/sbin/cupsd" key="cups-open-files"
--
time->Fri Jul 3 15:31:31 2015
type=PATH msg=audit(1435930291.853:393): item=0 name="/etc/cups/cups-files.conf" inode=5376875 dev=08:05 mode=0100644 ouid=0 ogid=0 rdev=00:00 nametype=NORMAL
type=CWD msg=audit(1435930291.853:393): cwd="/"
type=SYSCALL msg=audit(1435930291.853:393): arch=c000003e syscall=2 success=yes exit=4 a0=7fd5c55ce090 a1=0 a2=0 a3=23 items=1 ppid=1 pid=8175 auid=4294967295 uid=0 gid=0 euid=0 suid=0 fsuid=0 egid=0 sgid=0 fsgid=0 ses=4294967295 tty=(none) comm="cupsd" exe="/usr/sbin/cupsd" key="cups-open-files"
--
time->Fri Jul 3 15:31:31 2015
type=PATH msg=audit(1435930291.853:394): item=0 name="/etc/group" inode=5377472 dev=08:05 mode=0100644 ouid=0 ogid=0 rdev=00:00 nametype=NORMAL
type=CWD msg=audit(1435930291.853:394): cwd="/"
type=SYSCALL msg=audit(1435930291.853:394): arch=c000003e syscall=2 success=yes exit=5 a0=7fd5c0909351 a1=80000 a2=1b6 a3=2f items=1 ppid=1 pid=8175 auid=4294967295 uid=0 gid=0 euid=0 suid=0 fsuid=0 egid=0 sgid=0 fsgid=0 ses=4294967295 tty=(none) comm="cupsd" exe="/usr/sbin/cupsd" key="cups-open-files"
--
The Linux audit framework is a great alternative to strace, but might be less friendly to configure. Especially on a system which already has watches going on, you might want to skip inserting a few test rules. In that case use strace instead.
Got some others tools to track disk and file activity on running processes? Let it know!

