strace cheat sheet
This article has last been updated at .
The strace utility is very powerful to learn what a new or running process is doing. Due to its diversity of monitoring options, the tool is less accessible at first. This strace cheat sheet helps with getting the best out of this tool.
Normally cheat sheets come in a single 1 page PDF. In this case, we combined it all within a blog post. First section shows an explanation per area, the bottom of the post contains all useful commands for quick reference.
Commonly used strace options
Strace has many options, so here is a list of options that are typically can be found.
| Long option | Short option | Intended action |
|---|---|---|
| --summary-only | -c | Report a summary on program exit and include counts for time, errors, calls for each system call |
| --follow-forks | -f | Track process including forked child processes |
| --output=FILENAME | -o FILENAME | Log strace output to a file |
| --attach=PID | -p PID | Track a process by PID |
| --trace-path=PATH | -P PATH | Track a process when interacting with specified path |
| --syscall-times | -T | Display times in the output |
Troubleshooting with strace
One of options of the strace utility is to help as a troubleshooting utility. If you want to know what a process is doing, or why it hangs, strace will definitely help. By running strace without any parameters, it will already show why a process is doing. You can trace a running process, or instruct strace to start it for you.

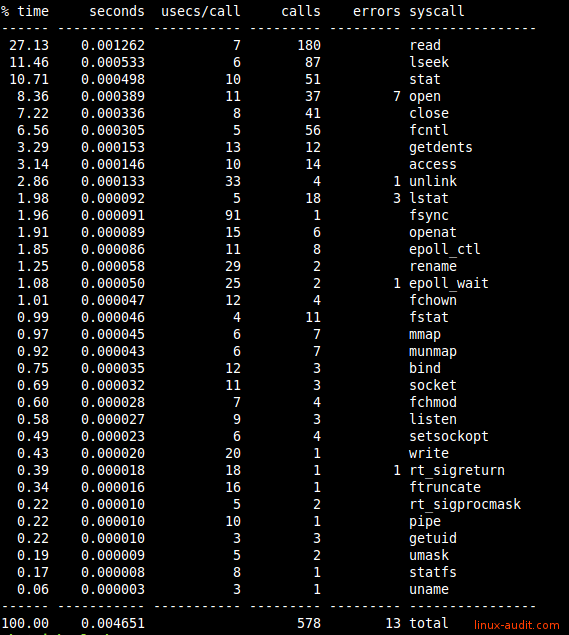
All syscall listed by amount of time
Monitoring
File activity
Strace can monitor file related activity. There are two useful parts. The first is file, which shows file interactions. The other one allows tracing file descriptors. Both can be used to monitor for actions like opening files, reading/writing and closing. Usually using “trace=file” provides enough insights. If you really need more insights in the way a program deals with file descriptors, then use the second one.
- Monitor opening of files: strace -e open -p 1234
- See all file activity: strace -e trace=file -p 1234 or strace -e trace=desc -p 1234
If you want to track specific paths, use 1 or more times the -P parameter, following by the path.
# strace -P /etc/cups -p 2261
Process 2261 attached
- SIGHUP {si_signo=SIGHUP, si_code=SI_USER, si_pid=6149, si_uid=0} -
lstat("/etc/cups", {st_mode=S_IFDIR|0755, st_size=4096, ...}) = 0
openat(AT_FDCWD, "/etc/cups", O_RDONLY|O_NONBLOCK|O_DIRECTORY|O_CLOEXEC) = 7
getdents(7, /* 11 entries */, 32768) = 336
getdents(7, /* 0 entries */, 32768) = 0
close(7) = 0
openat(AT_FDCWD, "/etc/cups", O_RDONLY|O_NONBLOCK|O_DIRECTORY|O_CLOEXEC) = 7
getdents(7, /* 11 entries */, 32768) = 336
getdents(7, /* 0 entries */, 32768) = 0
close(7) = 0
Common calls:
| Syscall | Intended goal |
|---|---|
| access | Checks whether the calling process can access the pathname, dereferenced when it is a symbolic link |
| close | Close file descriptor |
| fchmod | Same as chmod, but used file by open file descriptor fd |
| fchown | Changes ownership of file, referred to by open file descriptor (fd) |
| fstat | Similar to stat(), but uses file descriptor fd |
| lseek | Reposition file offset for read/write |
| open | Opens file specified by pathname to allow reading or writing data |
| read | Read from file descriptor |
| statfs | Returns information about mounted file system |
See the syscalls overview for others.
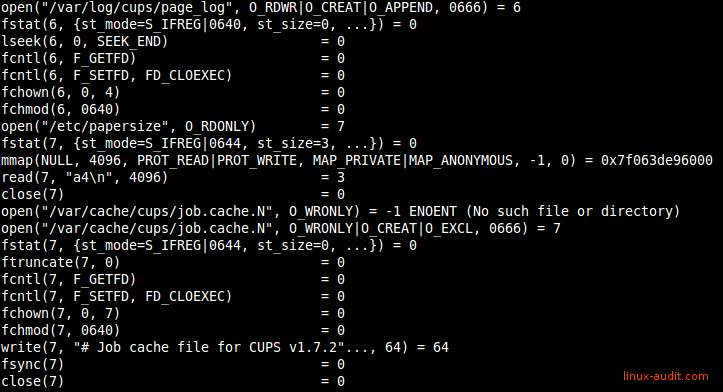
A related example screen output:

Monitoring file access and activity with strace
Network-related actions
Strace definitely can be useful for revealing more details about network traffic. Very useful to determine what network related connections are used, like when building your Docker image.
strace -e trace=network
Common syscalls:
- accept(2)
- bind(2)
- getsockopt(2)
- listen(2)
- socket(2)
- setsockopt(2)
Memory calls
To get better insights on the memory usage and system calls, strace can monitor for these as well. They are nicely grouped in the memory group.
strace -e trace=memory
Common syscalls:
- mmap(2)
- munmap(2)
Useful system call groups for tracing
Track by specific system call group
| Strace syscall group | Action performed |
|---|---|
| -e trace=ipc | Track communication between processes (IPC) |
| -e trace=memory | Track memory syscalls |
| -e trace=network | Track network syscalls |
| -e trace=process | Track process calls (like fork, exec) |
| -e trace=signal | Track process signal handling (like HUP, exit) |
| -e trace=file | Track file related syscalls |
Want to trace multiple syscalls instead of a full group? Combine them by specifying them directly instead of the syscall group.
strace -e open,close
Got other clever stracing tips? Let it know!

